News & System Status
To receive email updates, follow the DoIT group in myUMBC.
Using Google Doc "Versions" to Detect Student Originality vs. AI Abuse
Note: The following tip was shared as part of a 2/18/25 Faculty Development Center workshop, "Encouraging Academic Integrity in the Era of AI." Please feel free to adapt and make it your own....
Posted: May 14, 2025, 2:25 PM
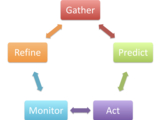
Why & How to Explore Analytics@UMBC
A brief (8 min) orientation and refresher
As part of UMBC’s data warehouse migration to HelioCampus, the Data Management Committee’s “Training & Outreach” working group has published a brief (8 min) video orientation on why and how to...
Posted: May 14, 2025, 1:44 PM
Cybersecurity Alert: Phishing Emails Targeting UMBC Benefits Information
Watch out for fake emails with subjects like "Meeting/[your name]" asking to review your pension and UMBC benefits. These are NOT legitimate and are part of a phishing campaign DoIT is tracking....
Posted: May 14, 2025, 1:03 PM
2025-26 Learning Analytics Mini Grant Proposals Due 6/6/25
All faculty and staff are eligible
The Division of Information Technology (DoIT), in partnership with the Office of the Provost, invites UMBC faculty members to submit proposals for the 2025 Learning Analytics (LA) Mini Grants....
Posted: May 14, 2025, 11:56 AM

- Go to page 1
- …
- Go to page 63
- Go to page 64
- Go to page 65
- Go to page 66
- Go to page 67
- …
- Go to page 607