How likely is it that a student will graduate in six years?
Early predictions give us more time to help!
The Data Science Team recently released its set of predictions for the 6-year graduation probabilities of the 2020 Freshman cohort. Below is a snapshot of the current cohort's predictions, in blue, with the 2019 Freshman cohort's predictions, in red.
The vertical axis represents the end of 2nd semester prediction probability; the horizontal axis is the end of the 3rd semester prediction.
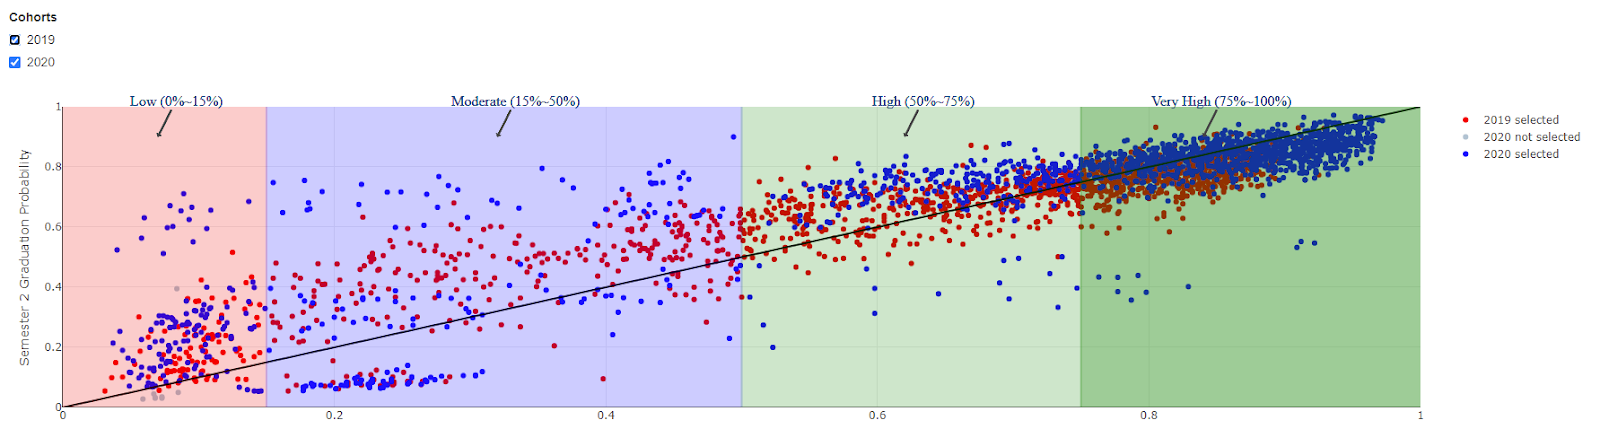
The black diagonal line indicates the point on the graph at which the second semester and third semester predictions are equal. If a dot, representing an individual student, rests on the line there was no change in the student's predicted probability of graduating between their second and third semester. Points above the line mean a student's predicted 6-year graduation probability decreased from semester 2 to semester 3.
The group of students above the line, particularly in the Moderate and Low probability color bands, are of concern as their predicted probabilities of graduation have declined over their last two completed semesters.
The 2020 Freshman cohort was the first freshman class during COVID and one of the concerns is the effect COVID may have on student performance in later semesters. From the predictions chart there seems to be reasons for optimism. Looking at the dispersion of points, there is a greater concentration of students in the High and Very High likelihood buckets compared to the 2019 cohort, as shown by the clustering of blue dots in the upper right corner of the chart.
However, some concern may remain. Students whose predictions fall in the Low and Moderate buckets have experienced sharper declines in predicted likelihood to graduate than students from the 2019 cohort (because the blue dots, 2020 cohort, are much further above the diagonal line than the red dots, 2019 cohort).
The diagram we've shown in this post is produced by a tool developed by the Data Science Team. The tool allows staff with broad student success responsibilities to identify groups of students who may need additional support to achieve their goals. The tool is available at analytics.umbc.edu in the student success section. Access to it requires permission.
(NOTE: Please join us Friday, March 18th from 12-1pm, for the fourth in our series of our Spring 2022 Data Science Workshops. This predictive model will be the topic of the session. Go to this link - https://my3.my.umbc.edu/groups/instructional-technology/events/101281 to register)
Len Mancini
Data Scientist and Statistical Specialist
Posted: March 16, 2022, 9:20 AM